The Cayman Islands
2018Bi-Annual Report
Cayman Islands
The Cayman Islands welcomed 1,314,875 total visitors (stayover arrivals and cruise passengers) for the period of January to June 2018. This was an increase of 214,711 persons or a 19.5% growth over the same period in 2017. Total visitation for the first six months was the highest in recorded history; surpassing the first half of 2004. The destination welcomed a record 1.3 million visitors for the first time.
Stayover visitation registered 2017 over 2018 growth of 15.9% which totalled 252,928 guests. Double-digit year over year growth was achieved for five (5) of the first six (6) months of 2018. Cruise passenger arrivals in 2018 totalled 1,061,947 passengers, which was a 20.4% growth over the first half of 2017.
In the first half of 2018, the destination received a total estimated visitor spend of KY$403.2 million. This was a KY$66.0 million or 19.6% increase over the same period of 2017.
International Tourism
UNWTO World Tourism Barometer (Jan. - Apr. 2018)
International tourism remains strong in the first four months of 2018.
According to the World Tourism Organization (UNWTO), international tourist arrivals (stayover visitors) grew 6% from January-April 2018 compared to the same period last year. UNWTO also reported that the results reflected a continuation of the strong trend seen in 2017 (+7%) and so far, exceed UNWTO’s forecast of 4% to 5% for the year 2018.
Growth in the first four months of 2018 was led by Asia and the Pacific (+8%) and Europe (+7%), while Africa (+6%), the Middle East (+4%) and the Americas (+3%) also recorded sound results. The Caribbean (-9%) experienced a decrease in arrivals during this period, which was impacted by the negative results from a few destinations that are still struggling with the effects of the hurricanes of August and September 2017. The January-April period represents approximately 28% of the annual arrivals and includes the winter sports season in the Northern Hemisphere, the summer season in the Southern Hemisphere, the Chinese New Year and the Easter holiday, among others.
Confidence in global tourism remains strong according to the latest UNWTO Panel of Tourism Experts survey. The Panel’s outlook for the current May-August period is one of the most optimistic in a decade, led by the particularly upbeat sentiment in Africa, the Middle East and Europe.
Arrivals by Month
Stayover
Continuing the pattern of sustained growth over the last nine months of 2017, the destination recorded increase for each of the first six months of 2018. March 2018 was the first time the destination welcomed over 50,000 stayover visitors in a single month. March and January recorded the highest growth rates with 25% and 24% increases respectively.
| Month | 2017 | 2018 |
| Jan | 31,634 | 39,185 |
| Feb | 35,547 | 40,020 |
| Mar | 44,056 | 54,965 |
| Apr | 38,927 | 39,057 |
| May | 29,342 | 35,916 |
| Jun | 38,729 | 43,785 |
Source: Cayman Islands Immigration Department
Cruise
The destination recorded double-digit growth in cruise passenger arrivals for each of the first six months of 2018. January 2018 had the highest increase with 36,665 more cruise passengers than January 2017; May 2018 increased by 30.3% to record the highest percentage increase.
| Month | 2017 | 2018 |
| Jan | 181,765 | 218,430 |
| Feb | 189,704 | 220,603 |
| Mar | 199,844 | 232,902 |
| Apr | 125,284 | 151,687 |
| May | 94,523 | 123,203 |
| Jun | 90,809 | 115,122 |
Source: Port Authority of the Cayman Islands
Stayover Arrivals by Region
USA

YOY % change: 18.4%
% Share of Arrivals: 84.3%
UK and Ireland
YOY % change: 2.9%
% Share of Arrivals: 3.0%
Canada
YOY % change: 10.3%
% Share of Arrivals: 6.2%
Continental Europe

YOY % change: -8.8%
% Share of Arrivals: 1.6%
Rest of the World

YOY % change: -0.7%
% Share of Arrivals: 3.4%
Latin America

YOY % change: 12.1%
% Share of Arrivals: 1.5%
Cruise Arrivals by Cruise Line
Norwegian Cruise Line brought an additional 115,728 passengers to the destination in the first half of 2018 compared to the same period in 2017. This increase from Norwegian Cruise Line moved the cruise line from the fifth largest carrier of passengers to the third largest. Carnival Corporation brought 59,089 more passengers in the first half of 2018 compared to 2017.
Tuesday was the busiest day for cruise passenger arrivals in 2018. In the first half of 2017, Wednesday was the main cruise day in the Cayman Islands. This shift was mainly because of cruise lines bringing more passengers on Tuesday coupled with the fact that Carnival Corporation and Royal Caribbean who brought in the most passengers reduced the number of ships arriving into the destination on Wednesdays.
Major Cruise Corporations Cayman Islands Capacity
| Cruise Line | 2017 | 2018 |
| Carnival Corporation | 456,896 | 515,985 |
| Royal Caribbean | 224,499 | 221,439 |
| Norwegian Cruise Line | 42,345 | 158,073 |
| MSC Cruises | 92,292 | 105,234 |
| Disney | 53,158 | 53,612 |
| Other | 12,739 | 7,604 |
Major Cruise Corporations Cayman Islands Calls
| Cruise Line | 2017 | 2018 |
| Carnival Corporation | 147 | 177 |
| Royal Caribbean | 72 | 73 |
| Norwegian Cruise Line | 19 | 46 |
| MSC Cruises | 35 | 36 |
| Disney | 16 | 15 |
| Other | 13 | 14 |
Age and Gender
Gender of Stayover Visitors

Age of Stayover Visitors
The age group 36-49 accounted for 24.8% share of stayover visitors in the first half of 2018, which was a small decrease over 2017. This age group was followed closely behind by the 50-60 age category at 22.4% and 19-35 age group at 18.6%.
All age groups saw growth in arrivals. The 19-35 age group had the highest growth rate, increasing by 21.0%. The 0-18 age group recorded the lowest growth rate at 15.8%.


Average Age - 42 years old

Repeat Visitation
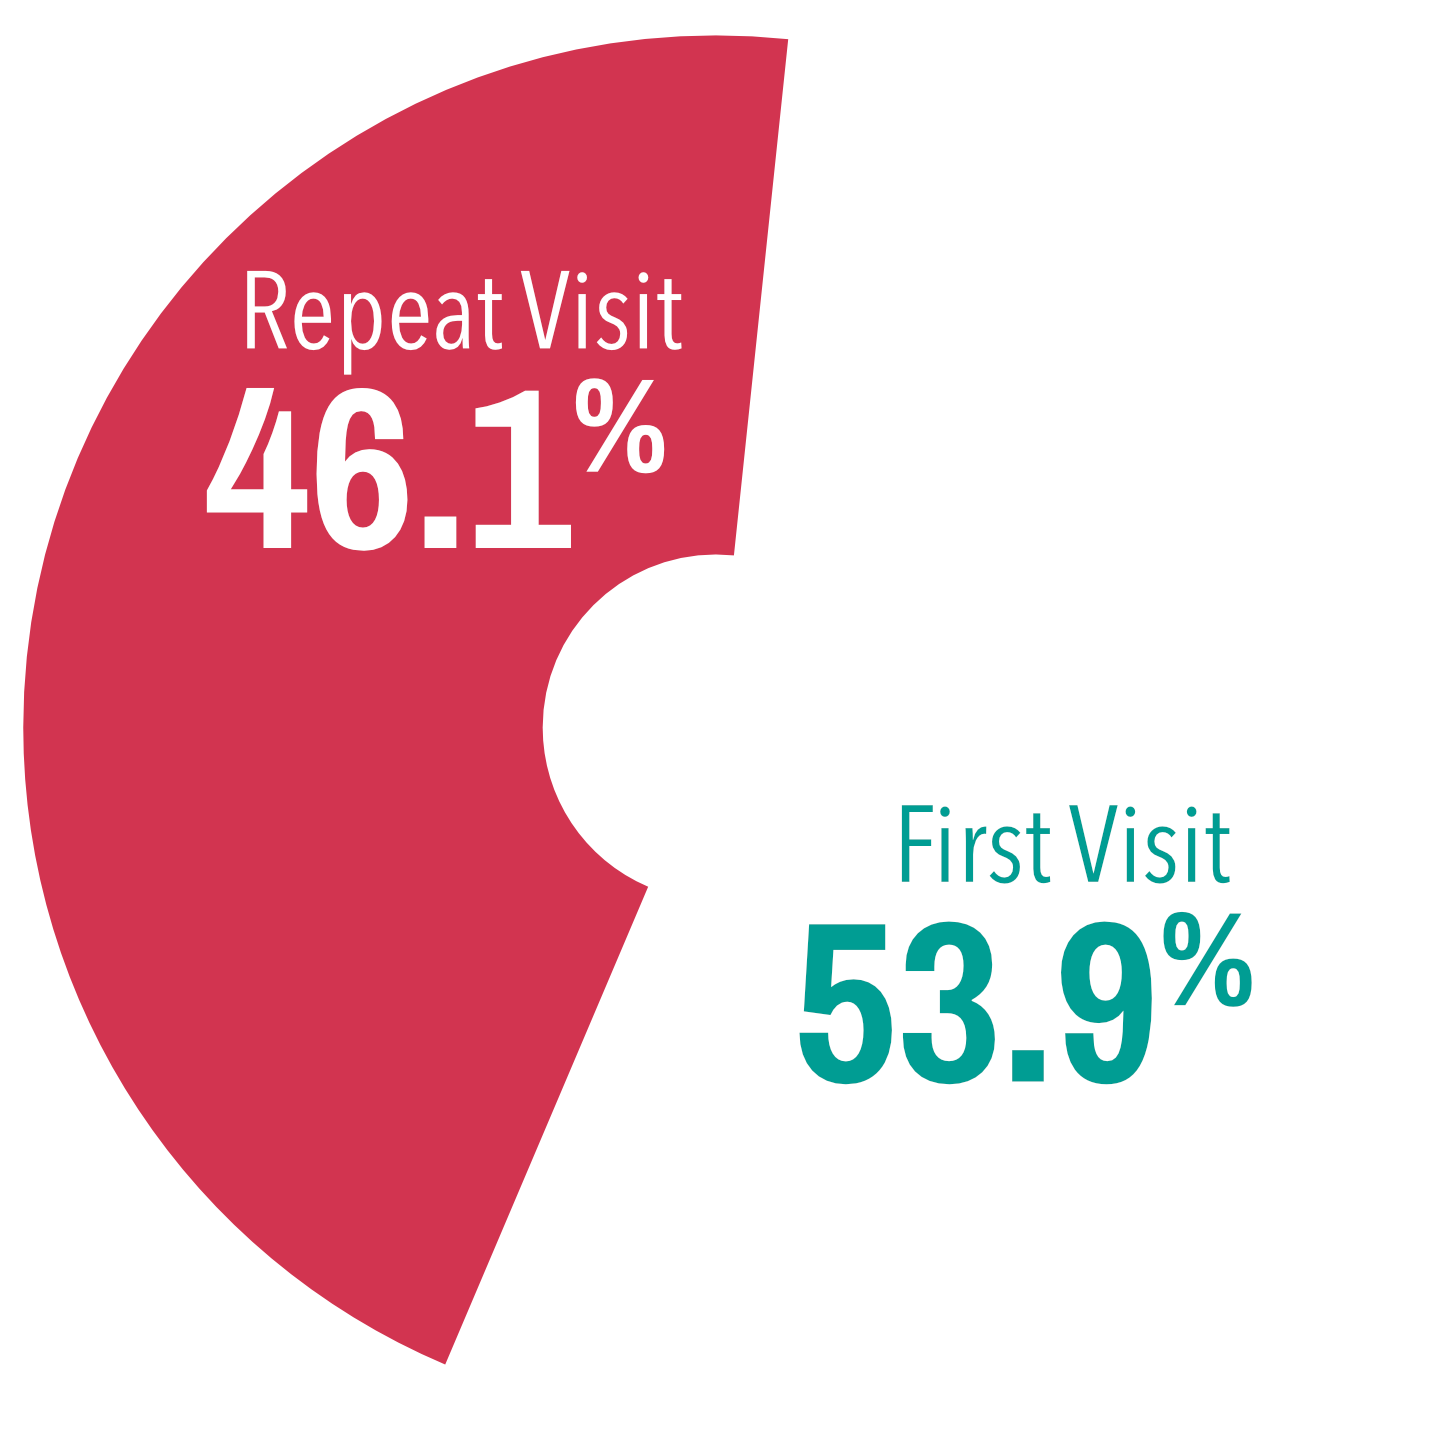
In the first half of 2018, 46.1% of visitors indicated that they had previously visited the Cayman Islands. The percent of visitors who previously visited the destination decreased by 2.8 percentage points from the 48.9% of visitors in the first half of 2017. The decrease in the repeat visitation percentage can be attributed to the fact that first-time visitation grew by more than twice the rate of repeat visitation. First-time visitation grew by 21.2% while repeat visitation saw growth of 8.6%.
Source: Cayman Islands Immigration Department
Average Length of Stay
The average length of stay decreased to 6.1 nights in 2018 from 6.2 nights when compared to 2017. UK and Ireland visitors had the longest average length of stay at 8.4 nights. Repeat visitors stayed an average 6.5 nights and persons visiting friends and relative stayed 7.7 nights.
Average Length of Stay by Region (Nights)
| Regions | 2017 | 2018 |
| Canada | 7.7 | 7.5 |
| Continental Europe | 6.5 | 6.5 |
| Rest of the World | 5.9 | 5.6 |
| South & Central America | 6.4 | 6.5 |
| UK & Ireland | 8.4 | 8.4 |
| USA | 6.0 | 5.9 |
| Grand Total | 6.2 | 6.1 |
Average Length of Stay by Previous Visits
Cruise Visitors Hours Ashore
Purpose of Visit
78.8% of stayover visitors main purpose of visit to the destination in the first half of 2018 was Recreation/Pleasure.

Recreation / Pleasure
2017: 78.8%2018: 78.8%

Visiting Relatives
2017: 4.9%2018: 4.8%

Business
2017: 6.3%%2018: 6.4%
Dive Vacation
2017: 3.9%2018: 3.7%

Wedding / Honeymoon
2017: 0.8%2018: 0.9%

Other
2017: 5.3%2018: 5.5%
Attractions Visited - Stayover
Stingray City was the most visited attraction by stayover visitors for the first half of 2018, with 55.4% of survey respondents reporting that they visited the attraction. Other places visited were Camana Bay (49.4%), Cayman Turtle Centre (47.2%) and Dolphin Discovery (29.1%).
 Stingray City
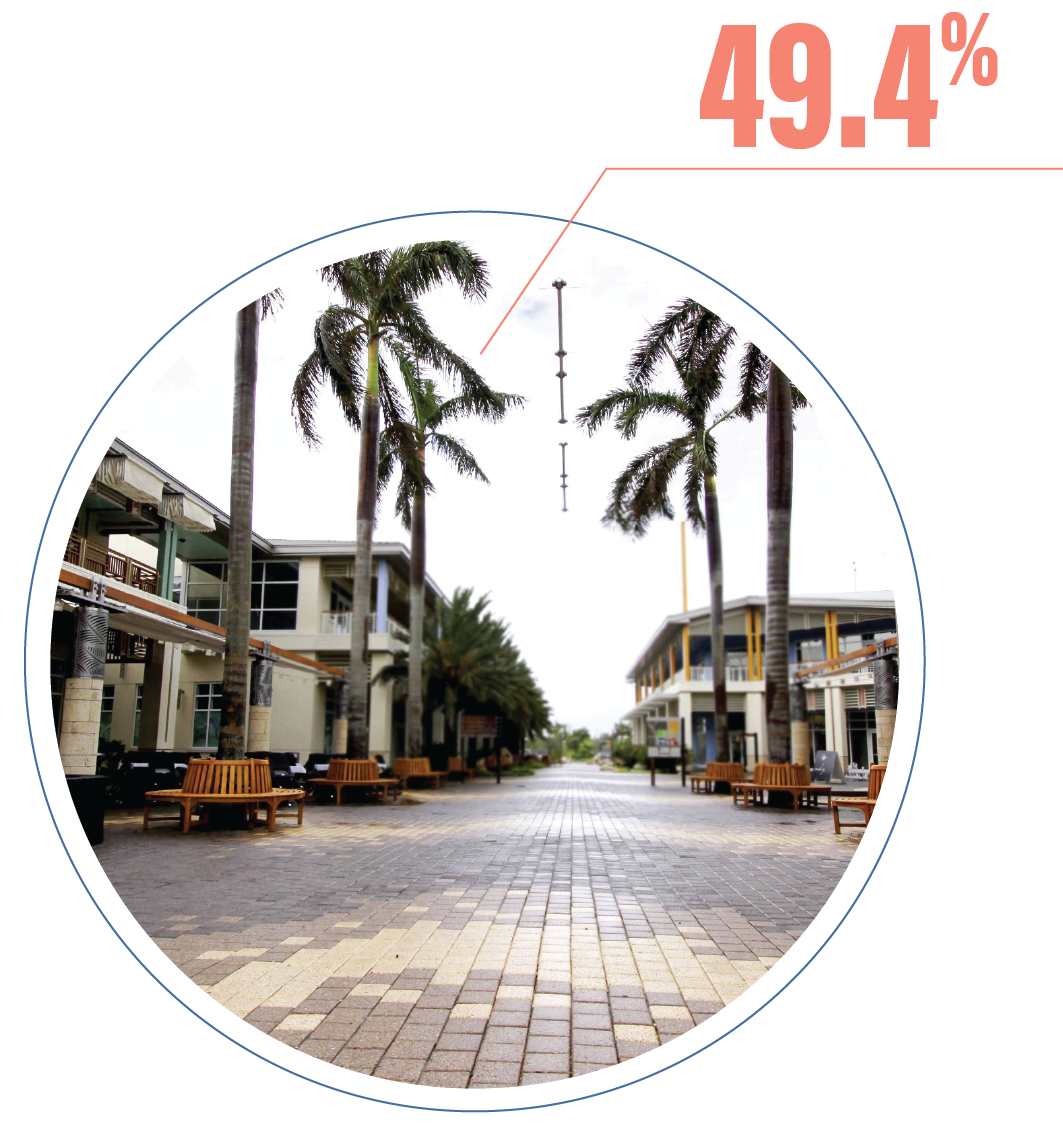 Camana Bay
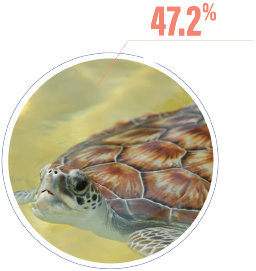 Cayman Turtle Centre
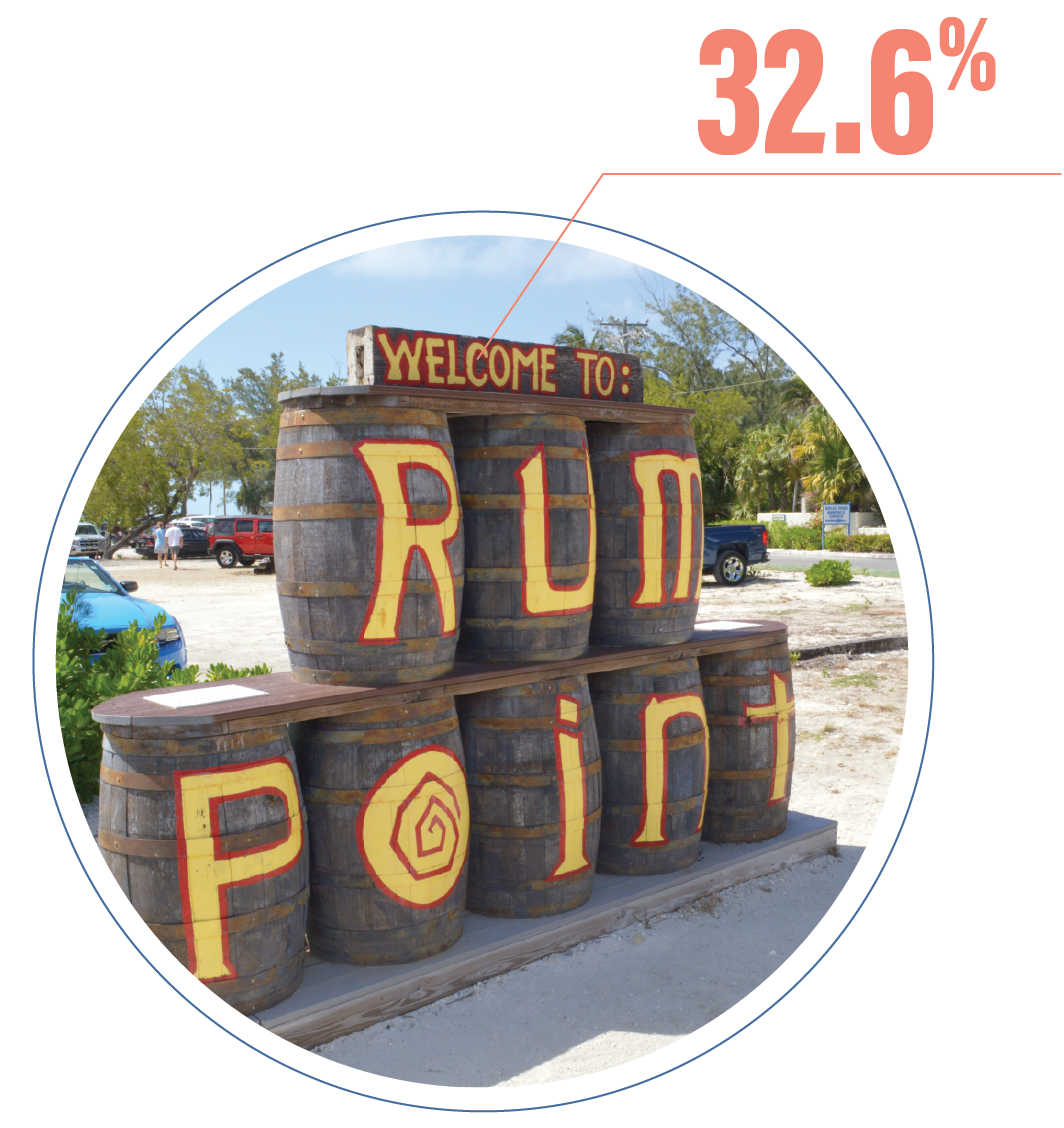 Rum Point
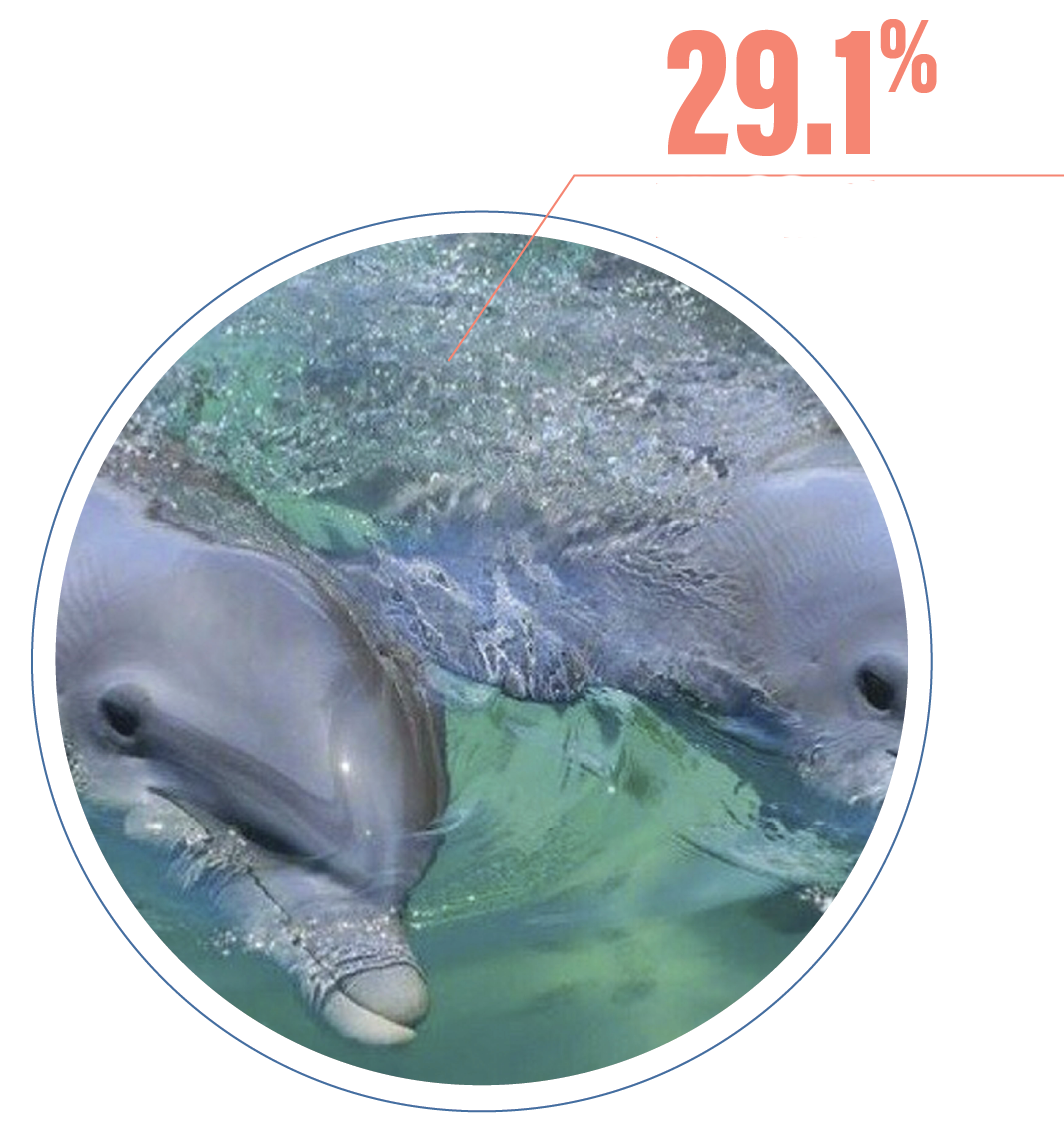 Dolphin Discovery
 Cayman Islands National Museum
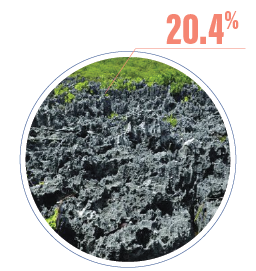 Hell Geological Site
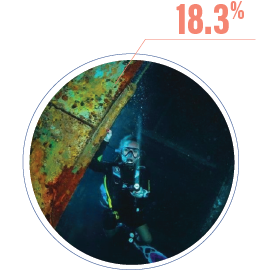 ex-USS Kittiwake
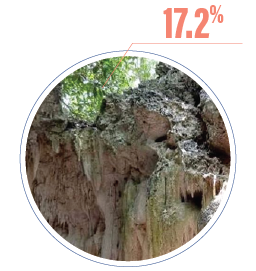 Cayman Crystal Caves
 Queen Elizabeth II Botanic Park
Attractions Visited - Cruise
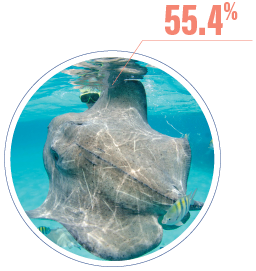
The Cayman Turtle Center was the most visited attraction by cruise visitors for the first half of 2018, with 53.9% of survey respondents reporting that they visited the attraction. Other popular attractions amongst Cruise Visitors included Dolphin Discovery (33.5%) and Stingray City (32.3%).
 Cayman Turtle Centre
 Dolphin Discover
 Stingray City
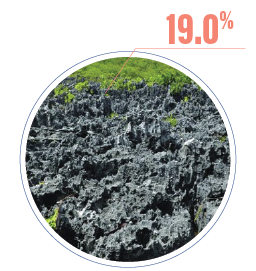 Hell Geological Site
 Cayman Islands National Museum
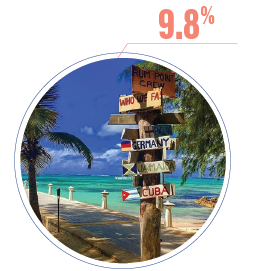 Rum Point
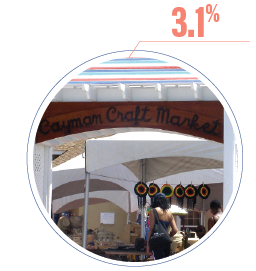 Cayman Craft Market
 Cayman Crystal Caves
 Queen Elizabeth II Botanic Park
 Mastic Trail
Rating of Destination
Stayover
When stayover survey respondents were asked to rate their "Overall Experience", 94% of respondents said it was "Very Good" and 5% "Good".
| Very Good | Good | Fair | Poor | Very Poor | |
| Overall experience | 94% | 5% | 1% | 0% | 0% |
| Value for money | 57% | 25% | 15% | 3% | 0% |
| Accommodations | 79% | 19% | 2% | 0% | 0% |
| Attractions | 89% | 10% | 1% | 0% | 0% |
| Beaches | 90% | 8% | 1% | 0% | 0% |
| Customer service | 90% | 9% | 1% | 0% | 0% |
| Restaurants | 82% | 16% | 2% | 0% | 0% |
| Shopping | 66% | 28% | 5% | 1% | 0% |
| Tours | 85% | 13% | 1% | 0% | 0% |
| Transportation | 65% | 30% | 4% | 1% | 0% |
| Underwater experience | 90% | 8% | 2% | 0% | 0% |
| Watersports | 89% | 10% | 1% | 0% | 0% |
Rating of Destination
Cruise
When cruise survey respondents were asked to rate their "Overall Experience", 93% of respondents said it was "Very Good" and 6% "Good".
| Very Good | Good | Fair | Poor | Very Poor | |
| Overall experience | 93% | 6% | 1% | 0% | 0% |
| Value for money | 80% | 16% | 3% | 1% | 0% |
| Attractions | 94% | 6% | 0% | 0% | 0% |
| Beaches | 95% | 4% | 1% | 1% | 0% |
| Customer service | 91% | 8% | 0% | 1% | 0% |
| Restaurants | 62% | 36% | 2% | 0% | 0% |
| Shopping | 66% | 33% | 1% | 0% | 0% |
| Tours | 90% | 10% | 0% | 0% | 0% |
| Transportation | 59% | 39% | 2% | 0% | 0% |
| Underwater experience | 80% | 15% | 0% | 5% | 0% |
| Watersports | 97% | 2% | 1% | 0% | 0% |
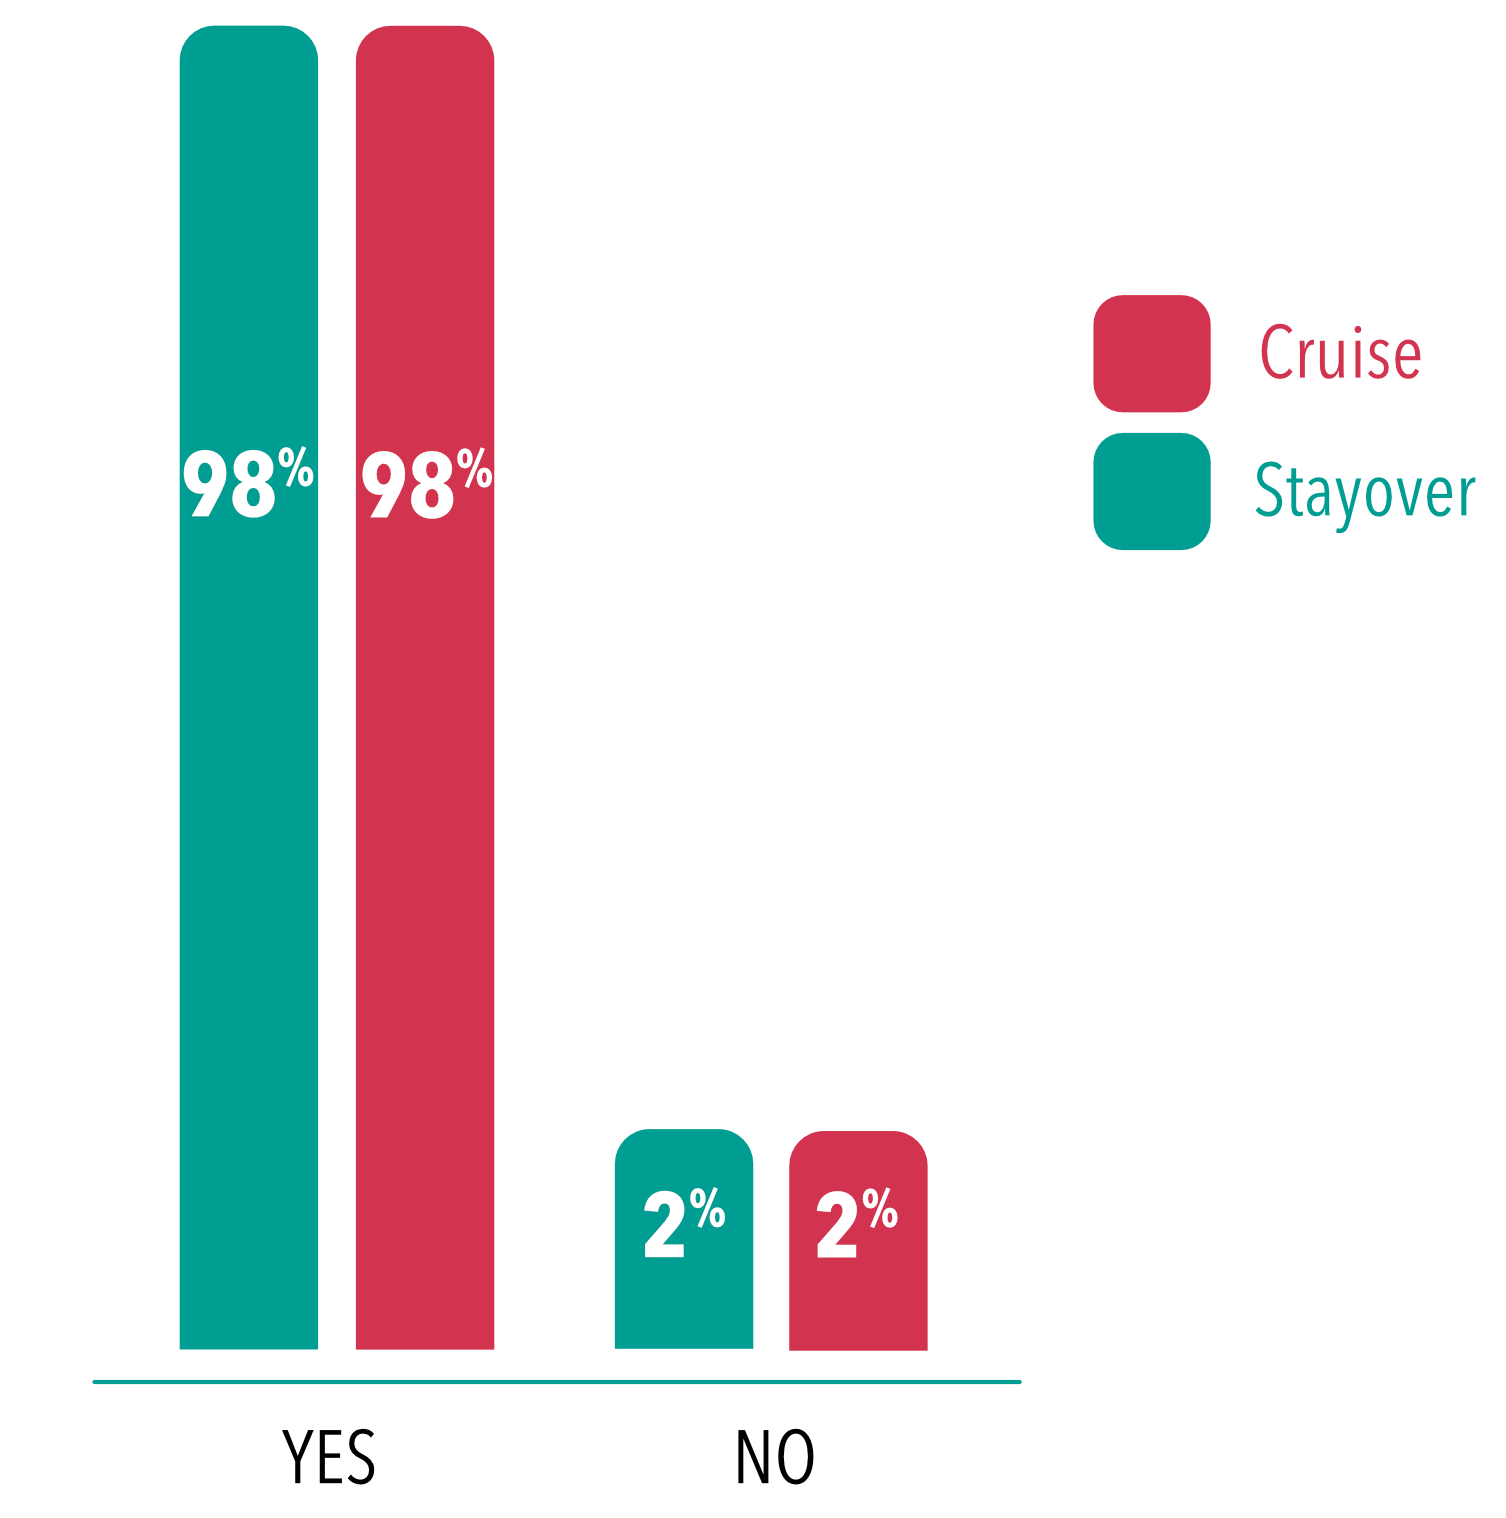
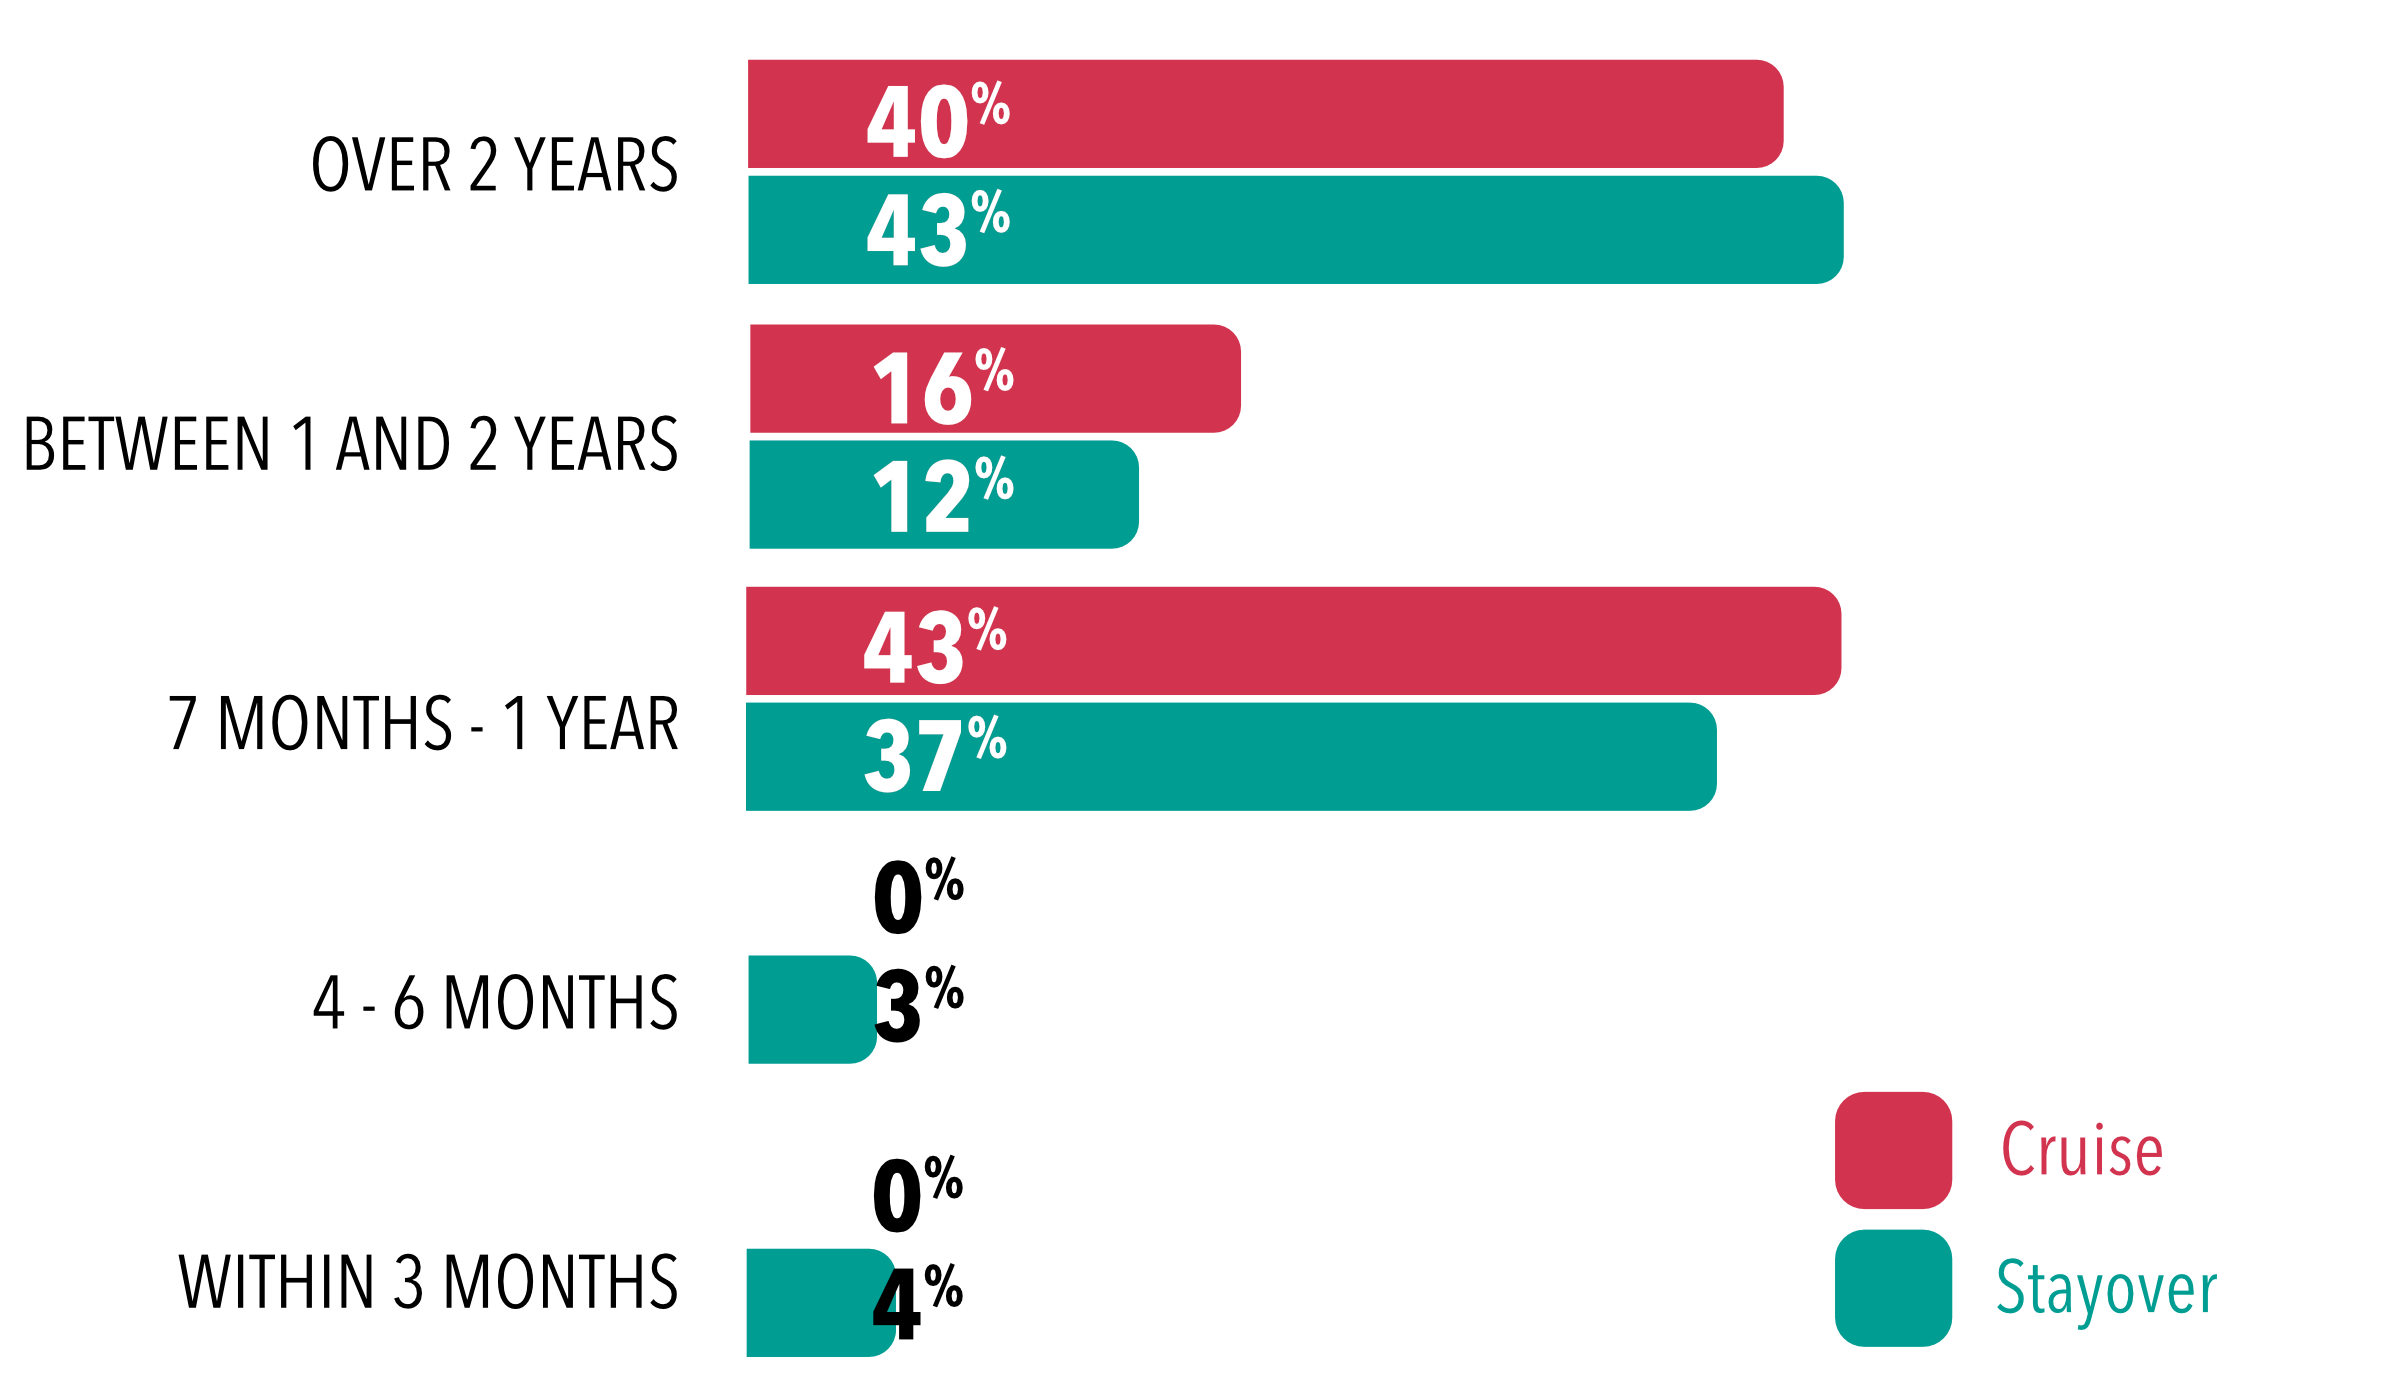
Travel Intentions
98% of stayover and cruise visitors surveyed reported that they would return to the destination by air.
Of those survey respondents who would like to return to the destination, 43% of stayover visitors anticipate returning in over 2 years and 43% of cruise respondents between 7 months and 1 year.
Accommodation Stock
Overall Accommodation Stock
Bedrooms: 6,414
Beds: 9,113
Bed Places (Capacity): 18,488
Bedroom Stock by Islan and Category
| Apartment | Guest House | Hotel | Total | |
| Cayman Brac | 72 | 121 | 52 | 245 |
| Grand Cayman | 2,771 | 795 | 2,457 | 6,023 |
| Little Cayman | 34 | 34 | 78 | 146 |
Expenditure
Stayover Visitor
| Jan-Jun | YOY Change | |||
| 2017 | 2018 | # | % | |
| Visitor Spending | ||||
| Total Arrivals (Persons) | 218,235 | 252,928 | 34,693 | 15.9 |
| Total Stayover Visitor Spending (KYD '000) | 259,554 | 309,067 | 49,513 | 19.1 |
| Average Spending per party (KYD) | 2,806.7 | 2,814.8 | 8.1 | 0.3 |
| Average Spending per person (KYD) | 1,189.3 | 1,222.0 | 32.7 | 2.7 |
| Average Spending per party per night (KYD) | 434.5 | 446.7 | 12.2 | 2.8 |
| Average Spending per person per night (KYD) | 184.1 | 193.9 | 9.8 | 5.3 |
| Average Length of Stay (nights) | 6.46 | 6.30 | -0.16 | |
| Average Spending Party Size (Persons) | 2.36 | 2.30 | -0.06 | |
Cruise Visitor
| Jan-Jun | YOY Change | |||
| 2017 | 2018 | # | % | |
| Visitor Spending | ||||
| Cruise Passenger Onshore Visits (Persons) | 793,738 | 955,753 | 162,015 | 20.4 |
| Total Cruise Visitor Spending (KYD '000) | 77,636 | 94,108 | 16,472 | 21.2 |
| Average Spending per party (KYD) | 220.1 | 218.7 | -1.4 | -0.6 |
| Average Spending per person (KYD) | 97.8 | 98.5 | 0.7 | 0.7 |
| Average Spending Party Size(KYD) | 2.25 | 2.22 | -0.03 | |
Total Visitors Spending
YOY = Year over Year Change
Source: The Cayman Islands Department of Tourism Visitor Exit Survey